mirror of
https://github.com/desktop/desktop
synced 2024-09-19 16:12:20 +00:00
2 KiB
2 KiB
Profiling Desktop using the Chrome Developer Tools
Sometimes performance issues are hard to identify and recreate. If you notice a regression and can reproduce it, you can use the Timeline tools in Chrome Dev Tools to take a snapshot of the application performance and attach it to an issue.
Steps
- Launch Desktop and select View | Toggle Developer Tools.

- Get the Desktop application ready to perform the problem action.
- Select the Timeline tab.
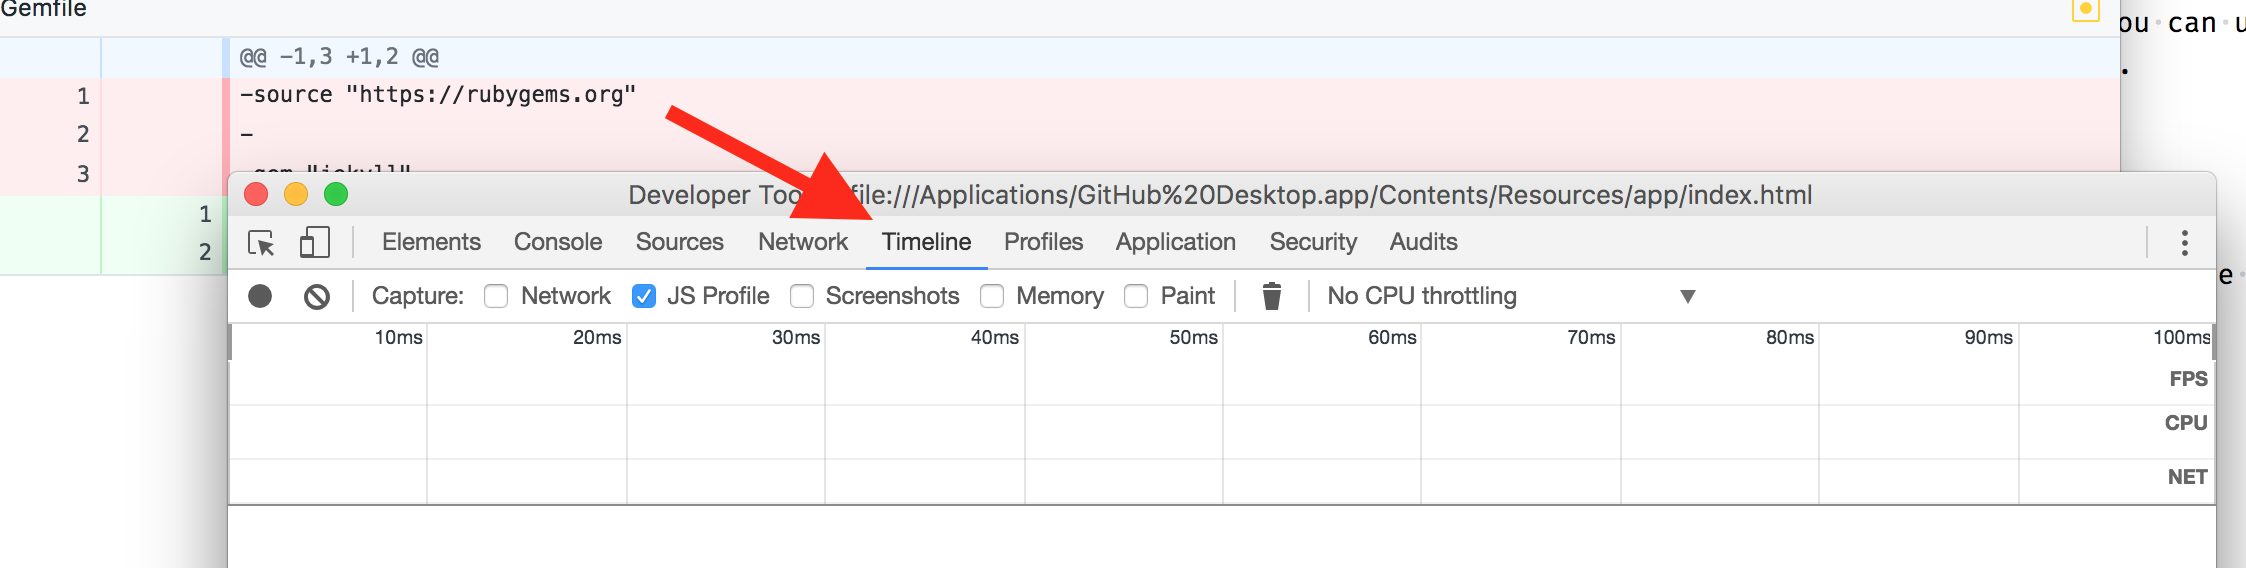
- Ensure you have JS Profile checked - other items might be helpful, but will add to the size of the generated timeline data.

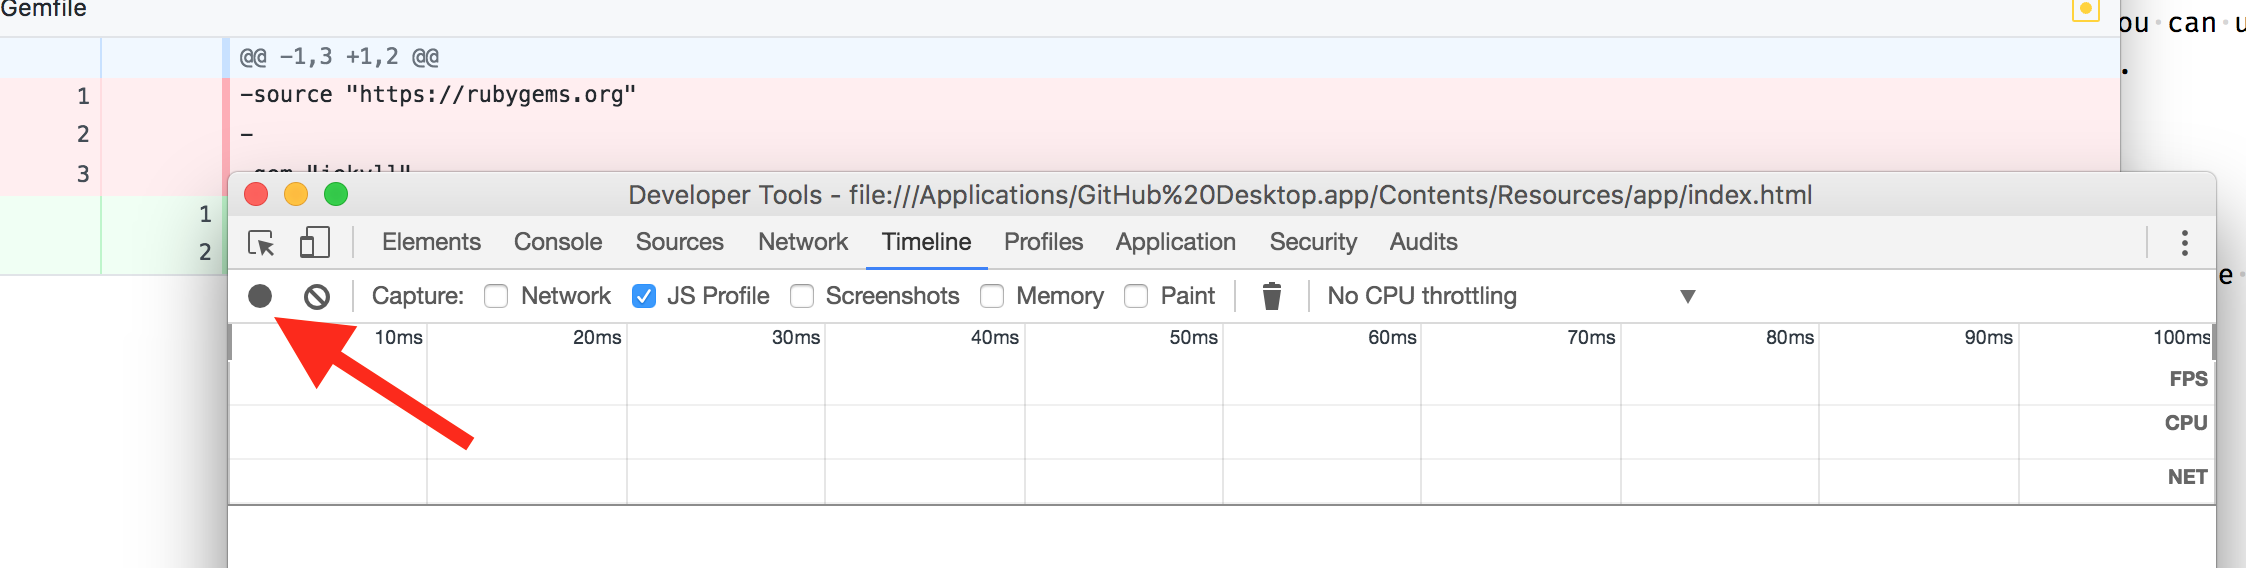
- Press the Record button on the left to start recording.
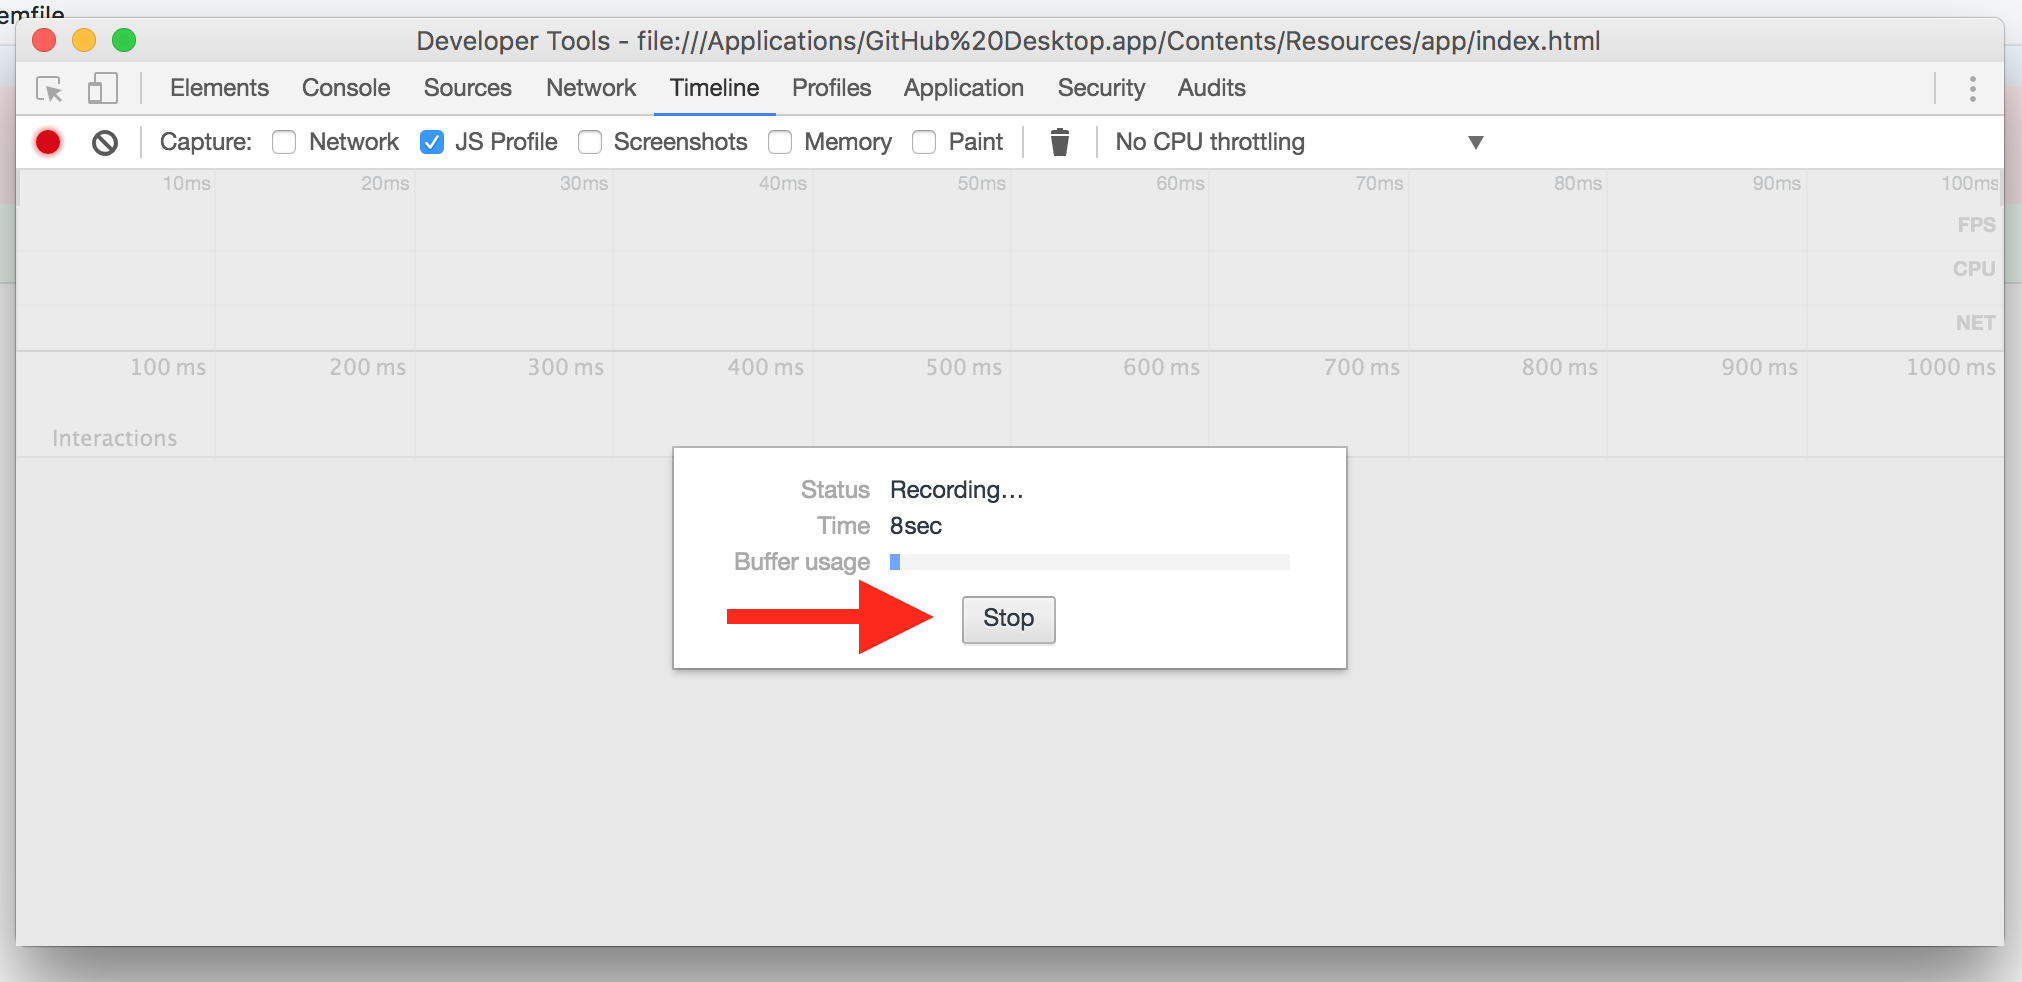
- Perform the problem action in Desktop. Try and keep the test focused on the issue you're seeing.
- Switch back to the Developer tools and press Stop to complete recording.
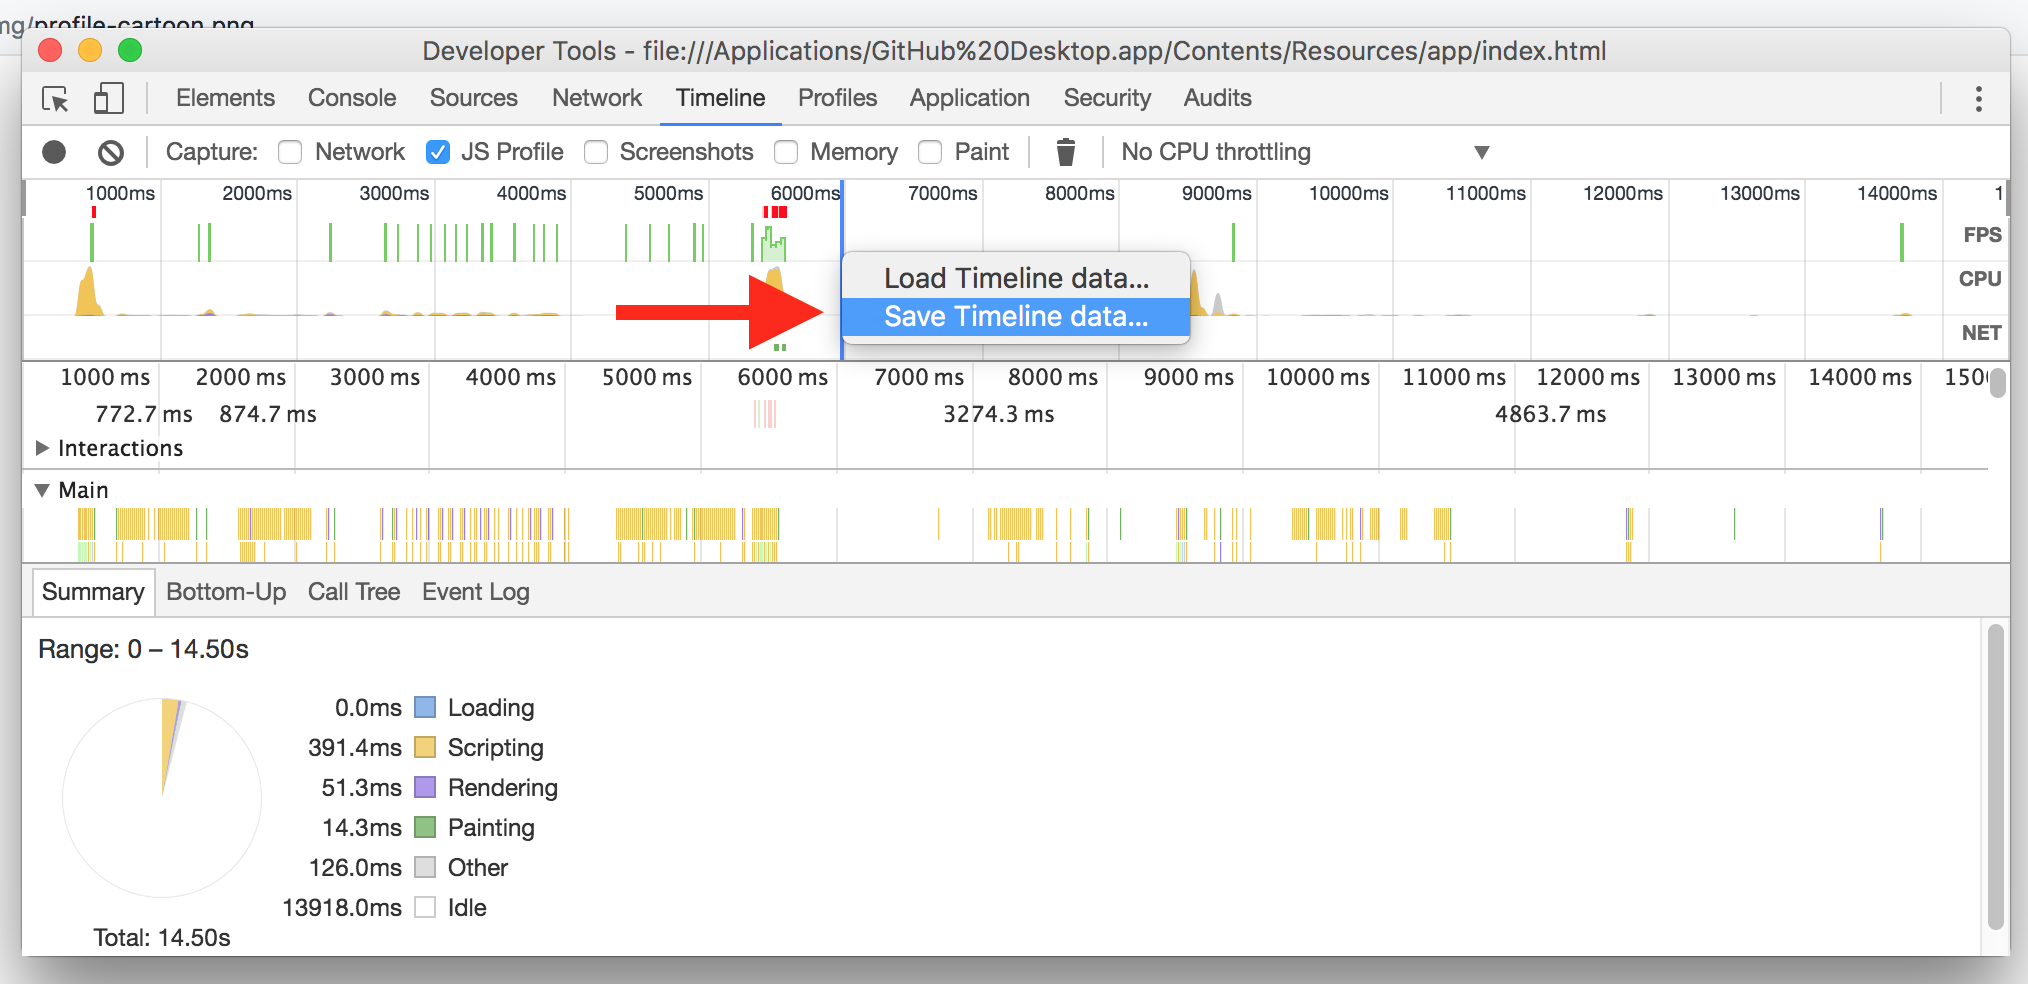
- In the graph section, right-click and select Save timeline data. Save the JSON file somewhere you can access later.
-
Compress the JSON file to reduce the file size (it could be 10MB or more depending on how long you ran the test for).
-
Attach the file to your GitHub issue so the contributors can load this into their environment and spelunk the diagnostic information.